
The Ultimate Google Analytics Dashboard
As you now know from one of my previous blogs, I am enrolled in a Digital Marketing course this semester at East Carolina University. During our Google Analytics portion of the class, we had a very talented guest speaker, Jenny Halasz, travel to Greenville so she could teach us more about utilizing this tool. Her presentation included the topic of accounts, properties, tagging, KPIs, reports, filters, managing dashboards, and understanding what all of the data that we receive in Google Analytics represents.
Not only did she share her knowledge on these topics, but she also gave us a link to a Google Analytics dashboard that she created. As soon as I got home from class that afternoon, I opened up my Google Analytics account and followed her step-by-step directions on how to add the dashboard. However, before I added it, I first created a new view called, “JLH Dashboard.”
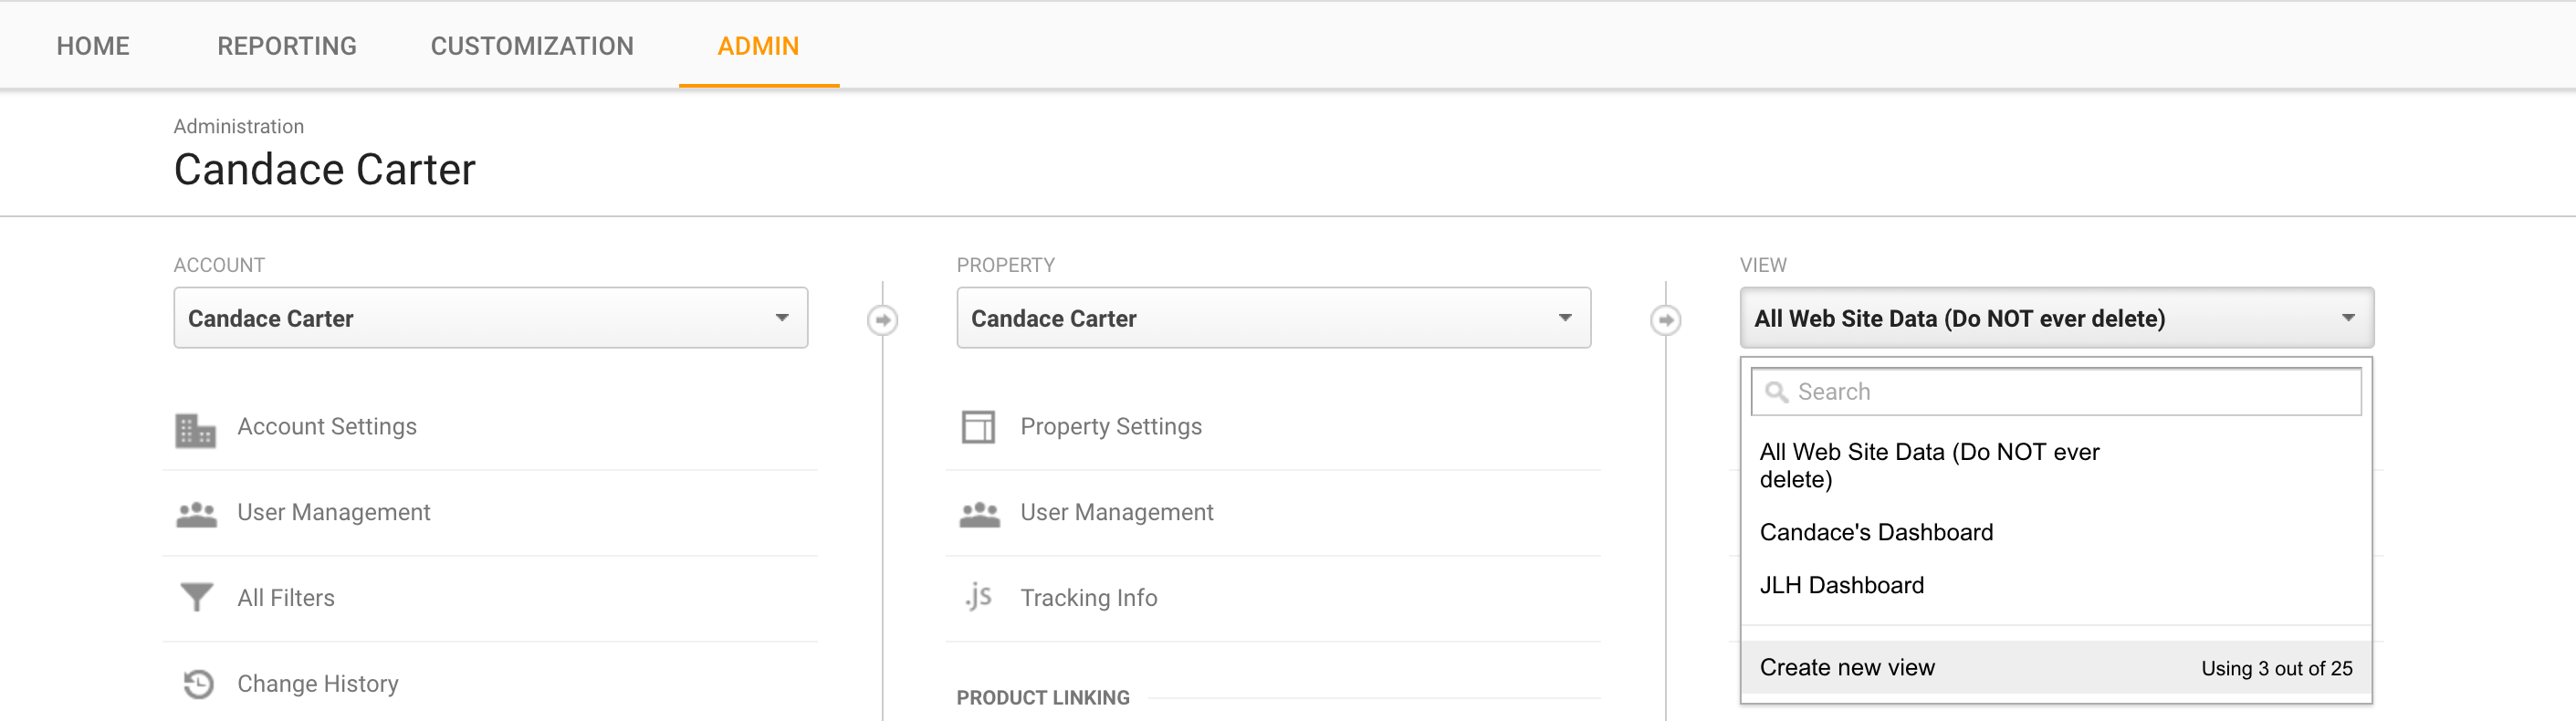
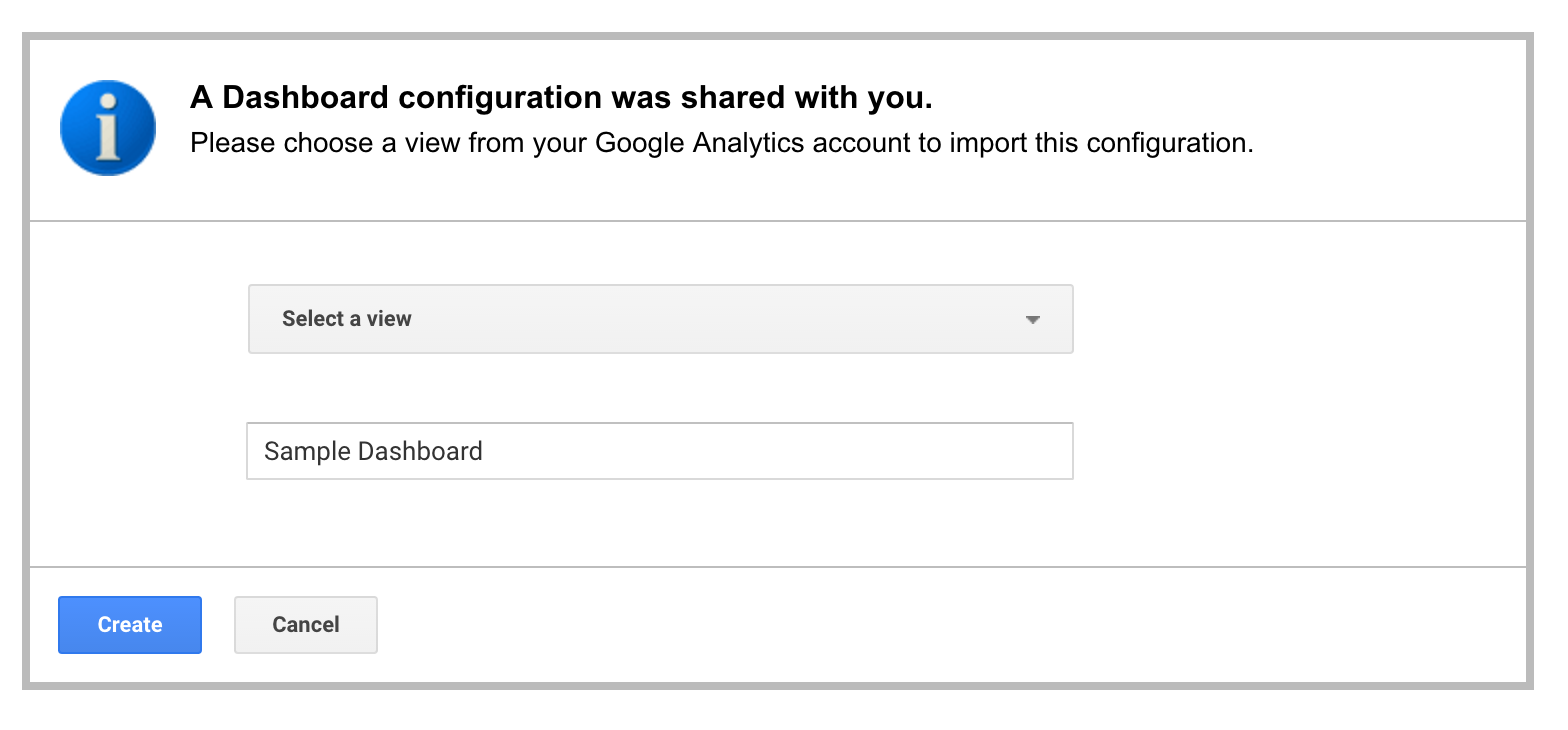
Once the new view was created, I pasted the link that Jenny gave our class into my browser. After it loaded, the page displayed a box that allowed me to select the new view I just created to apply the dashboard’s settings. I then titled the dashboard, “Dashboard – JLH,” and hit the create button.
Once the creation process was complete, I shared my website to all of my social media platforms, and the traffic to my site began to flow in. After I gave it some time, I logged back into my account the next morning to review all the data that was collected. From the home tab, I selected the new view that I created the afternoon before and began exploring the dashboard.
As a new user of Google Analytics, this dashboard made everything so much easier to understand. The configuration of the dashboard was really straightforward and provided relevant information. For instance, I could see in the form of a pie chart whether my traffic was coming from social or direct, which city the viewer was in at the time they visited, the social network that brought them to my site, the number of pages they looked at, the bounce rate, the pageviews for high traffic pages, exits, and more.
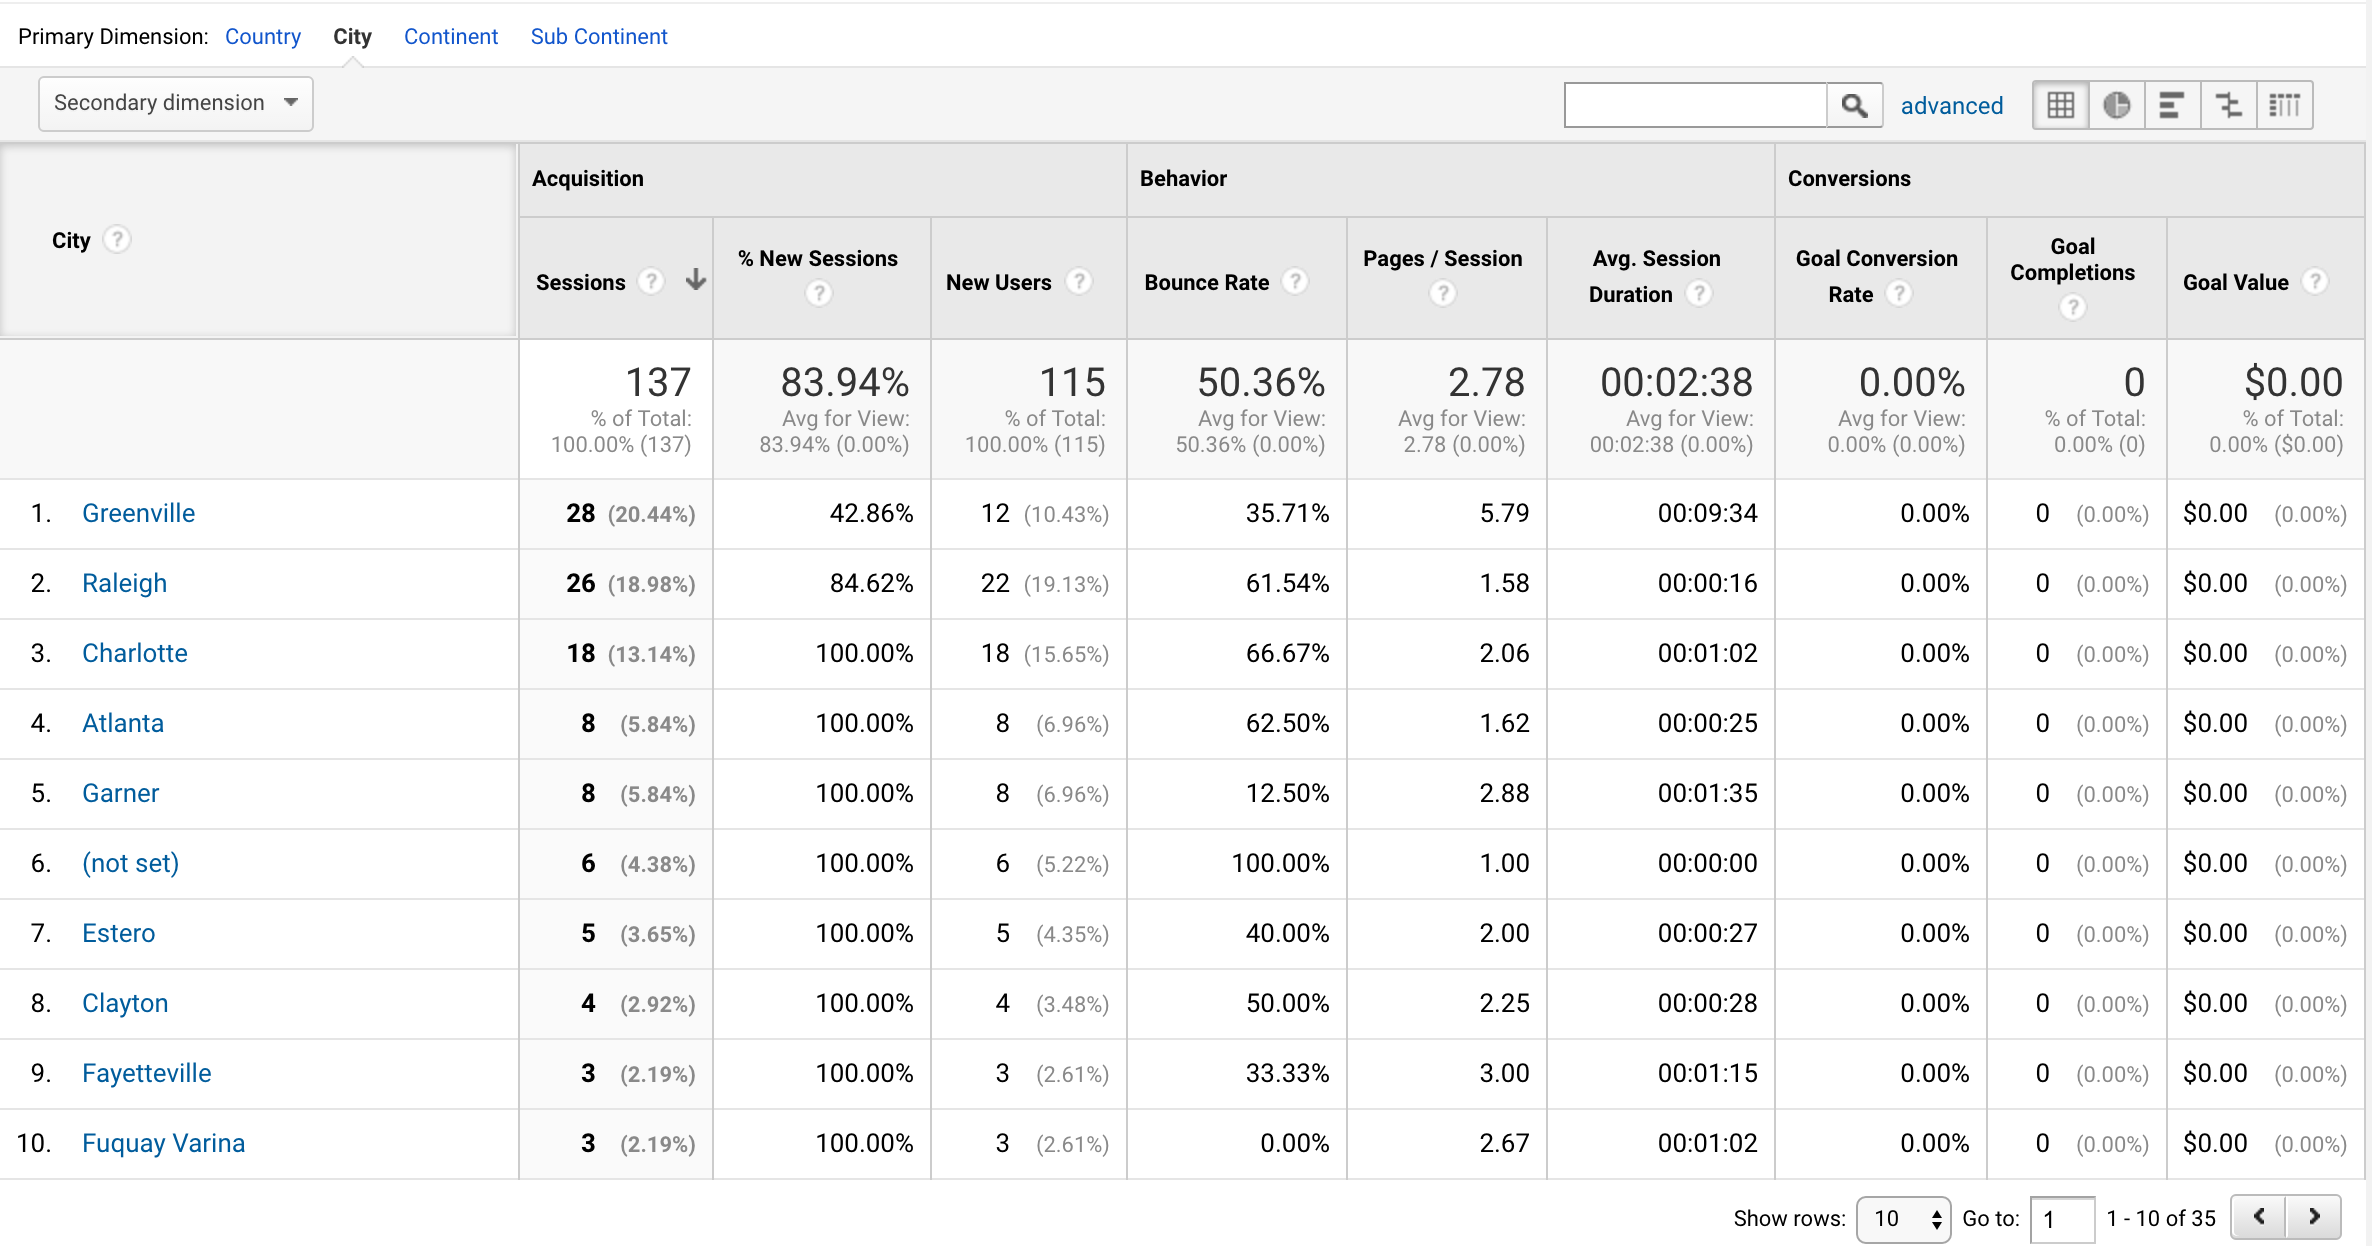
Here is the dashboard and the results that I obtained after I shared my website on social to my friends and family:
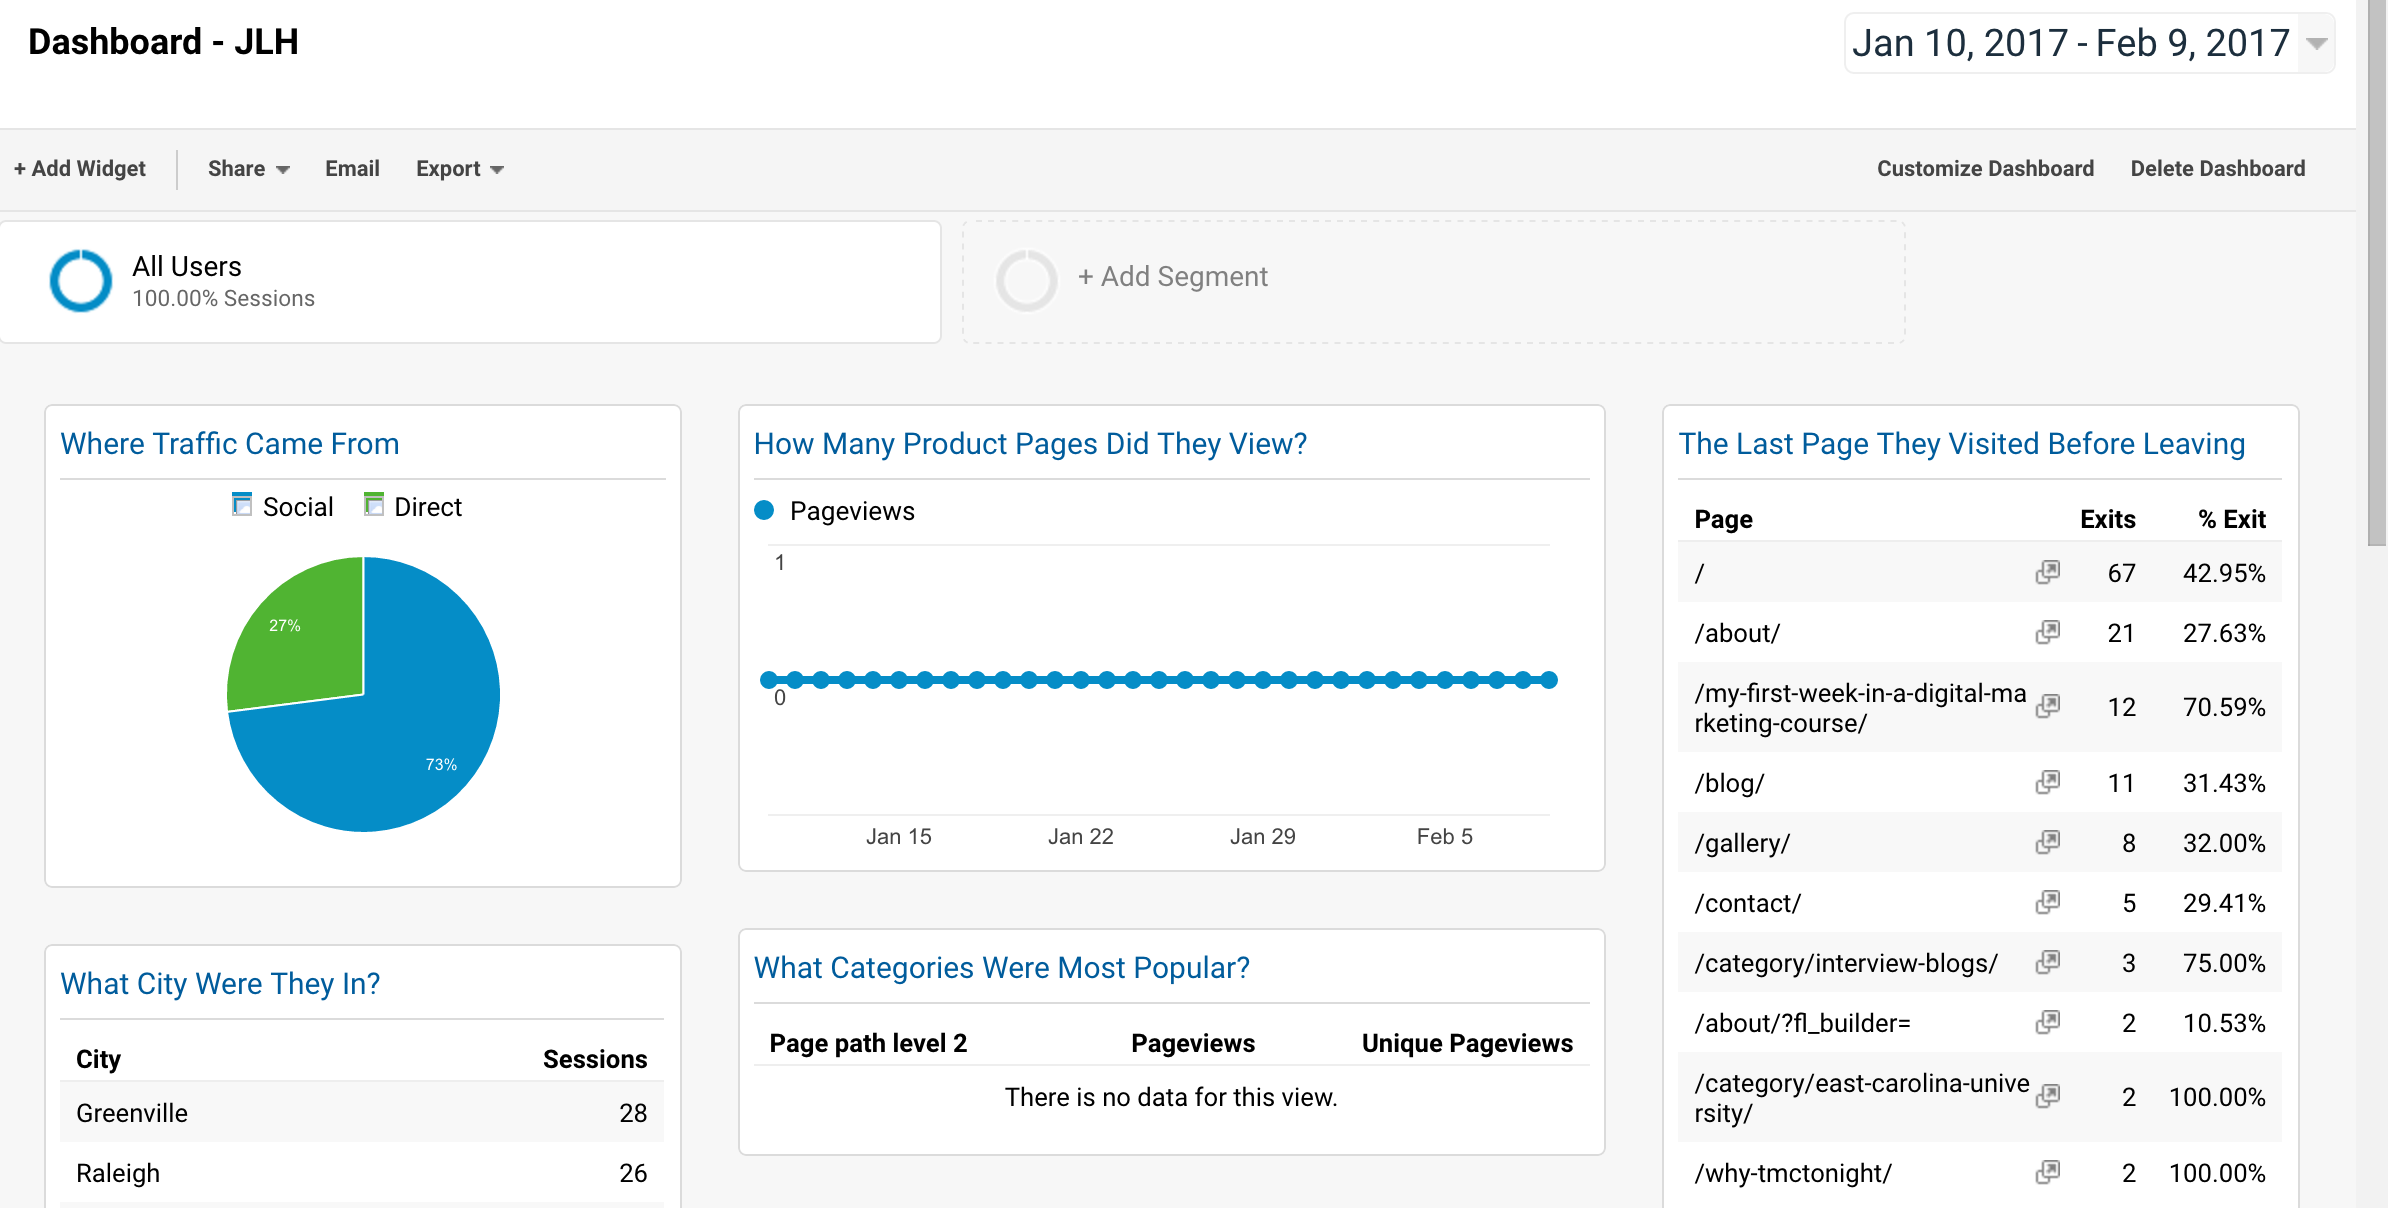
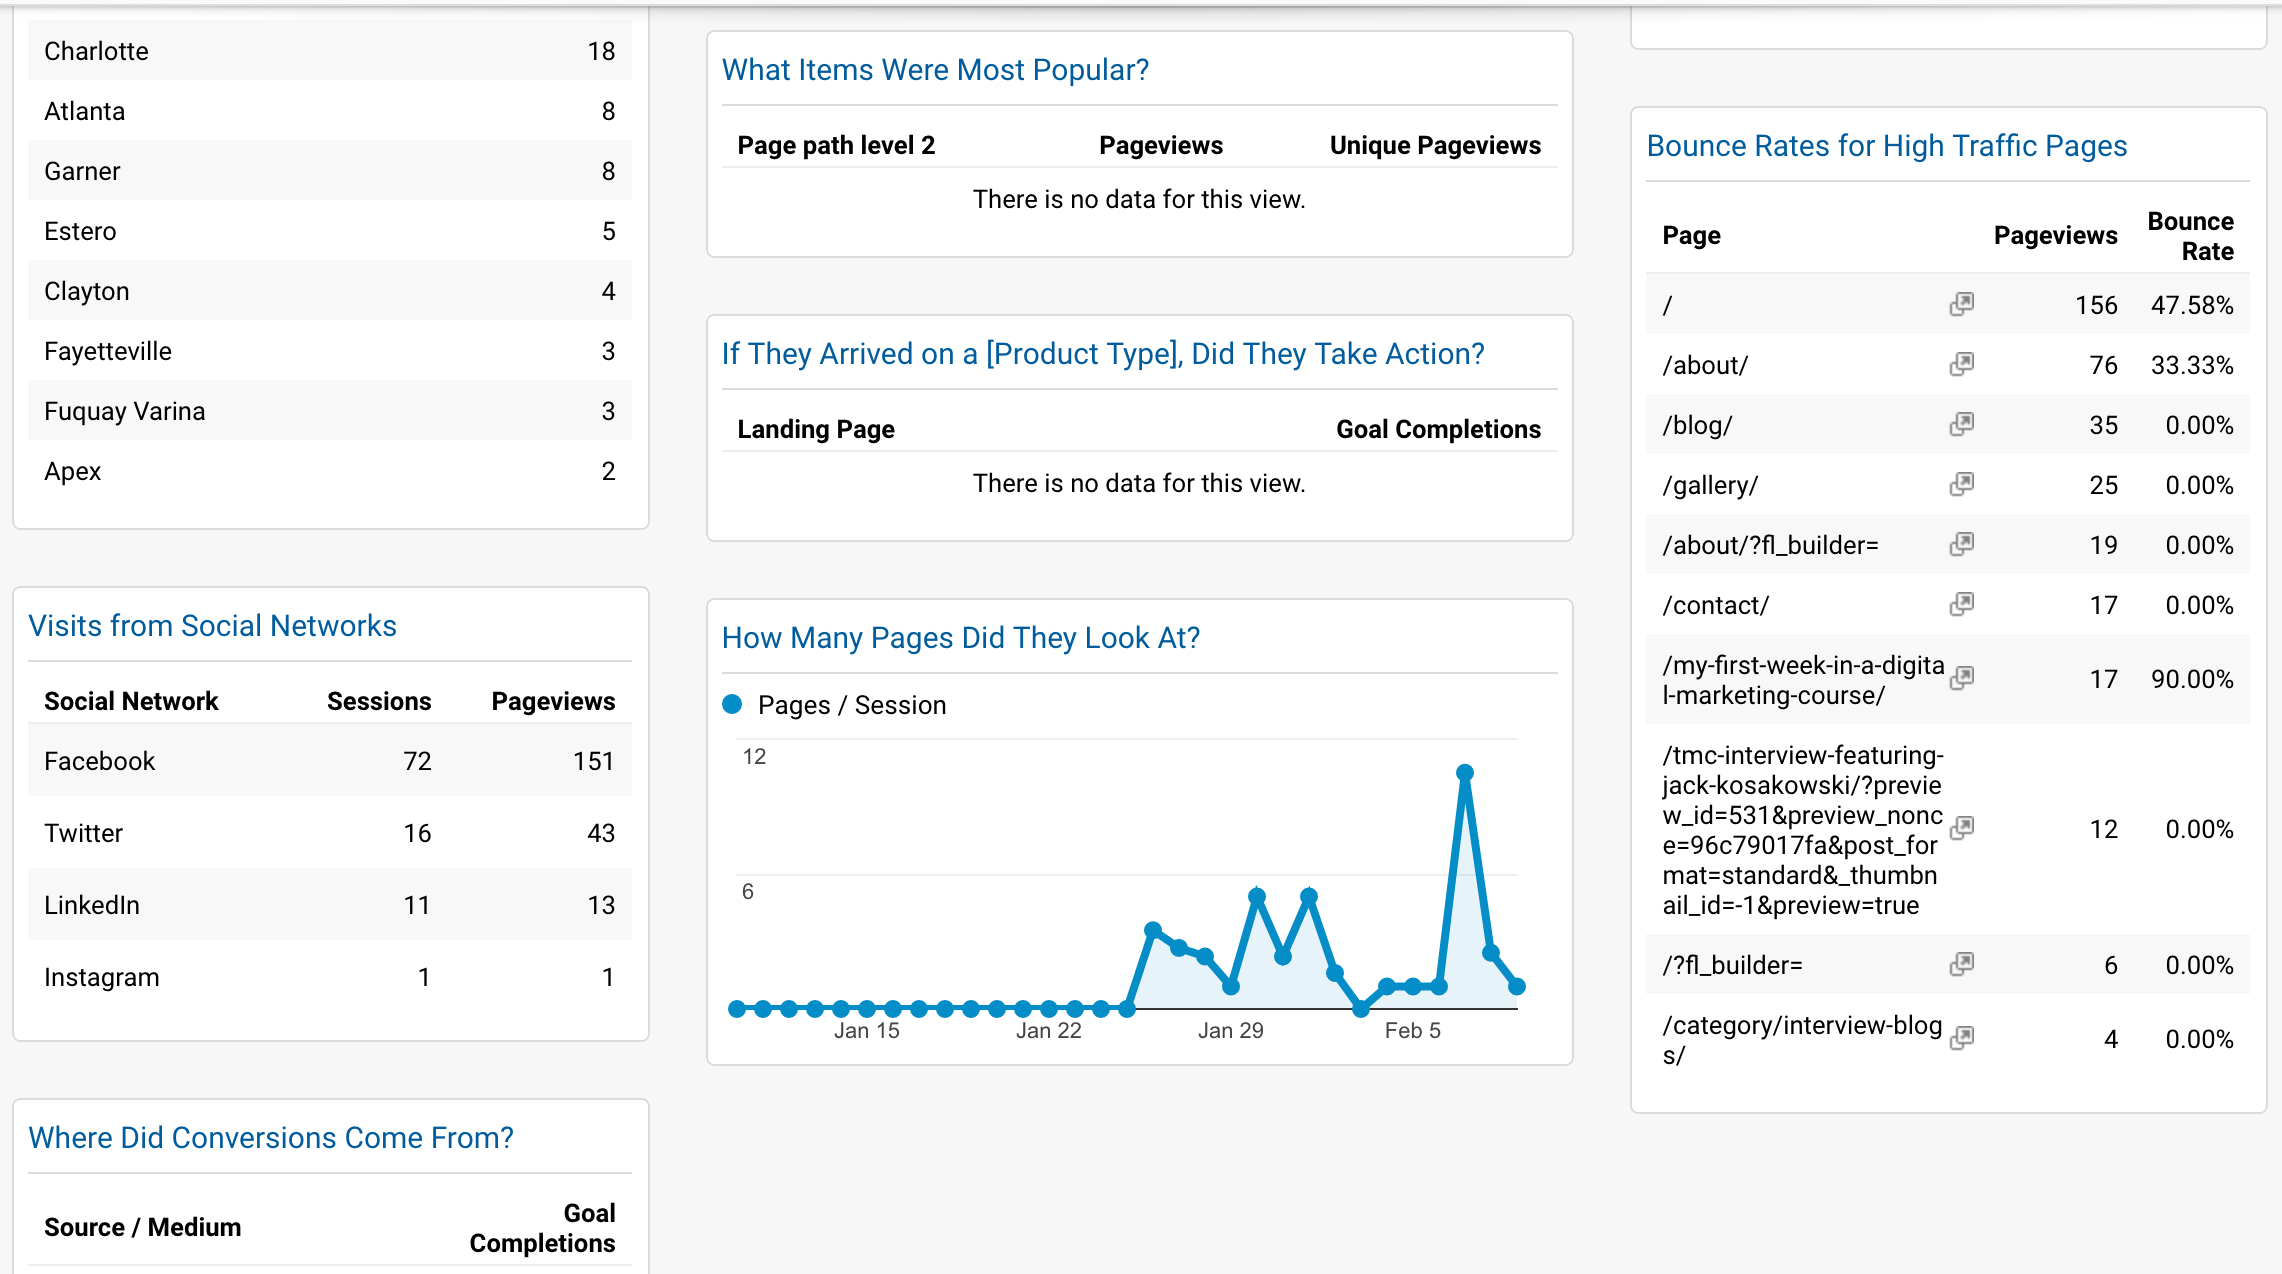
As you can see, this dashboard is very user-friendly and is a great tool to have. For example, I could easily tell from the results that the majority of my traffic came from social media, specifically Facebook with 72 sessions and 151 pageviews. Also, the viewers of my site were located in mostly Greenville, Raleigh, and Charlotte, North Carolina. Outside of the quick view in the dashboard, I could even dig deeper into each widget by clicking on the blue link at the top.
As Jenny told us, “This is your ultimate weapon.” I’m grateful that Jenny shared these awesome dashboard settings with us and shared her knowledge on the ins and outs of Google Analytics. I can honestly say that her presentation and applying what we learned has really helped me with navigating through my Google Analytics account.
Thanks again, Jenny!